Quantifying PPF - Minimum Thresholds and AI We Can Use
Identifying clinically relevant minimum thresholds on quantification software and how AI can make life easier and simpler
Case:
This was published as a Youtube Case of the Day 215.
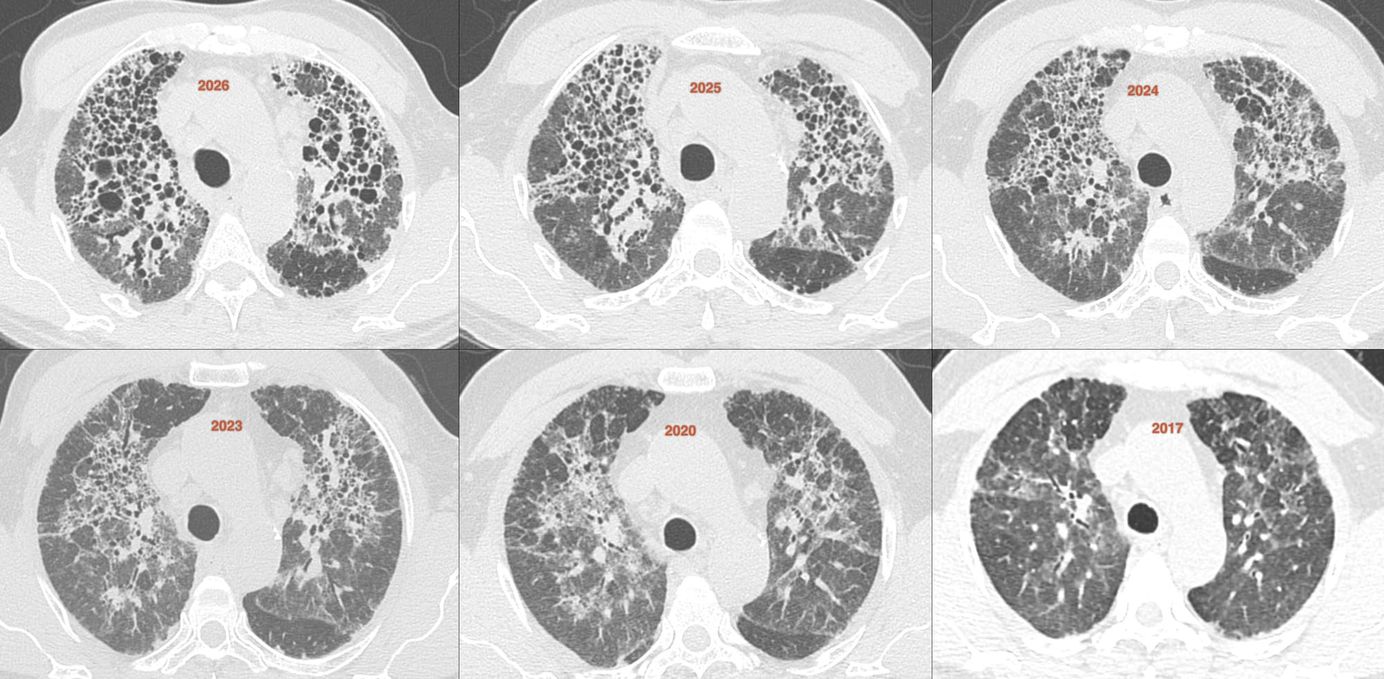
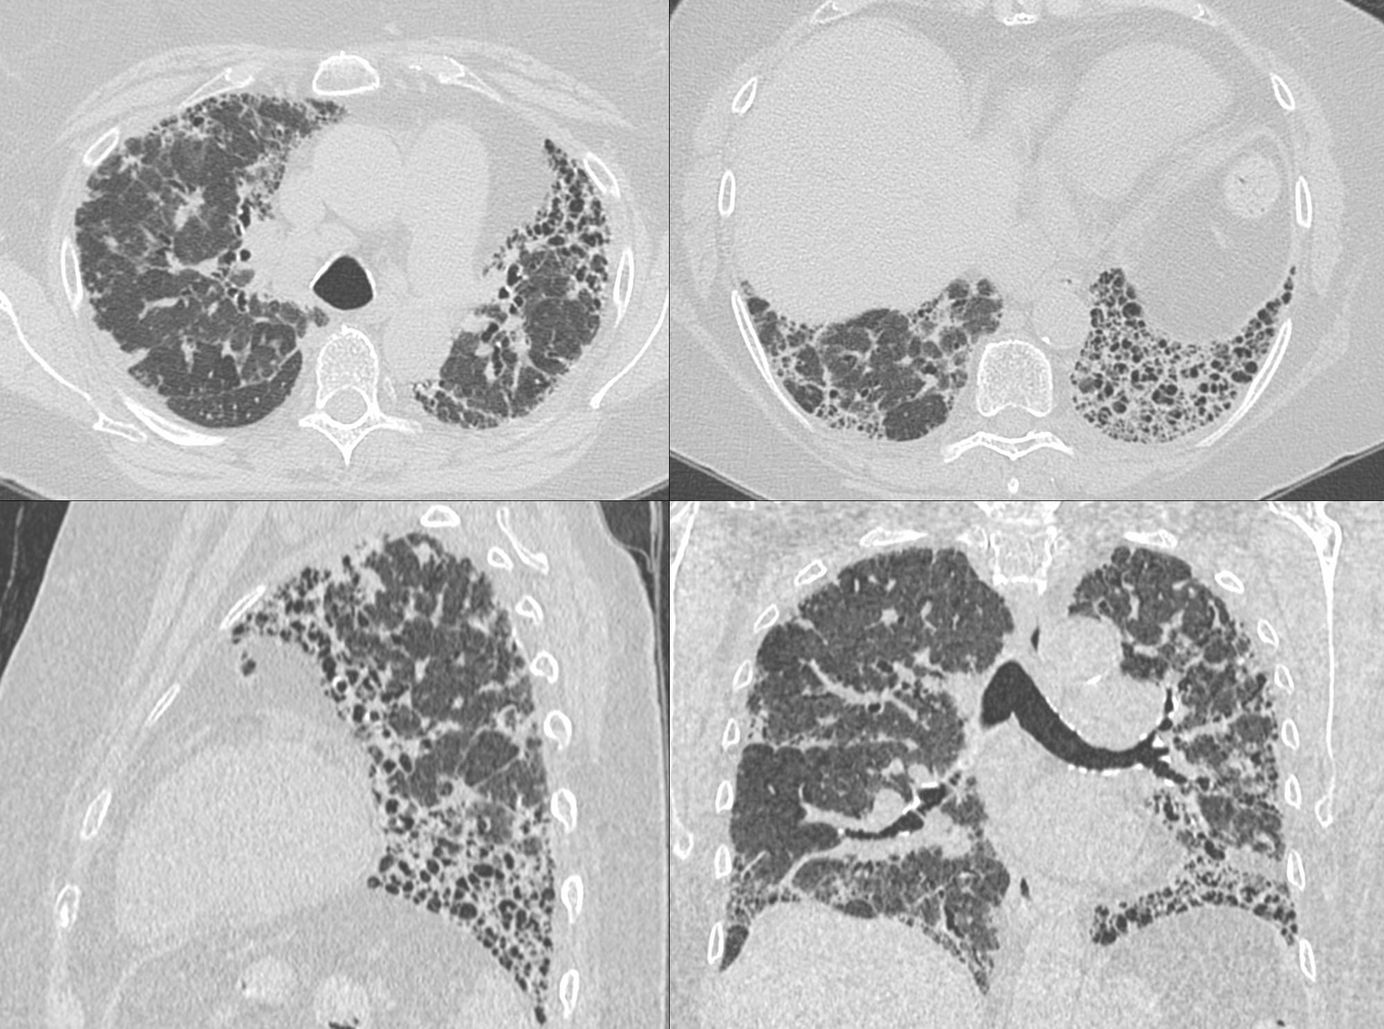
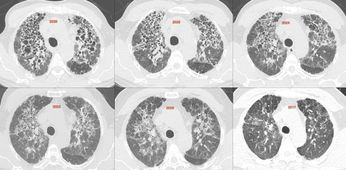
38-year-old presented with an ILD in Oct 2019, following which he had 6 scans (total of 7 scans) showing progression.
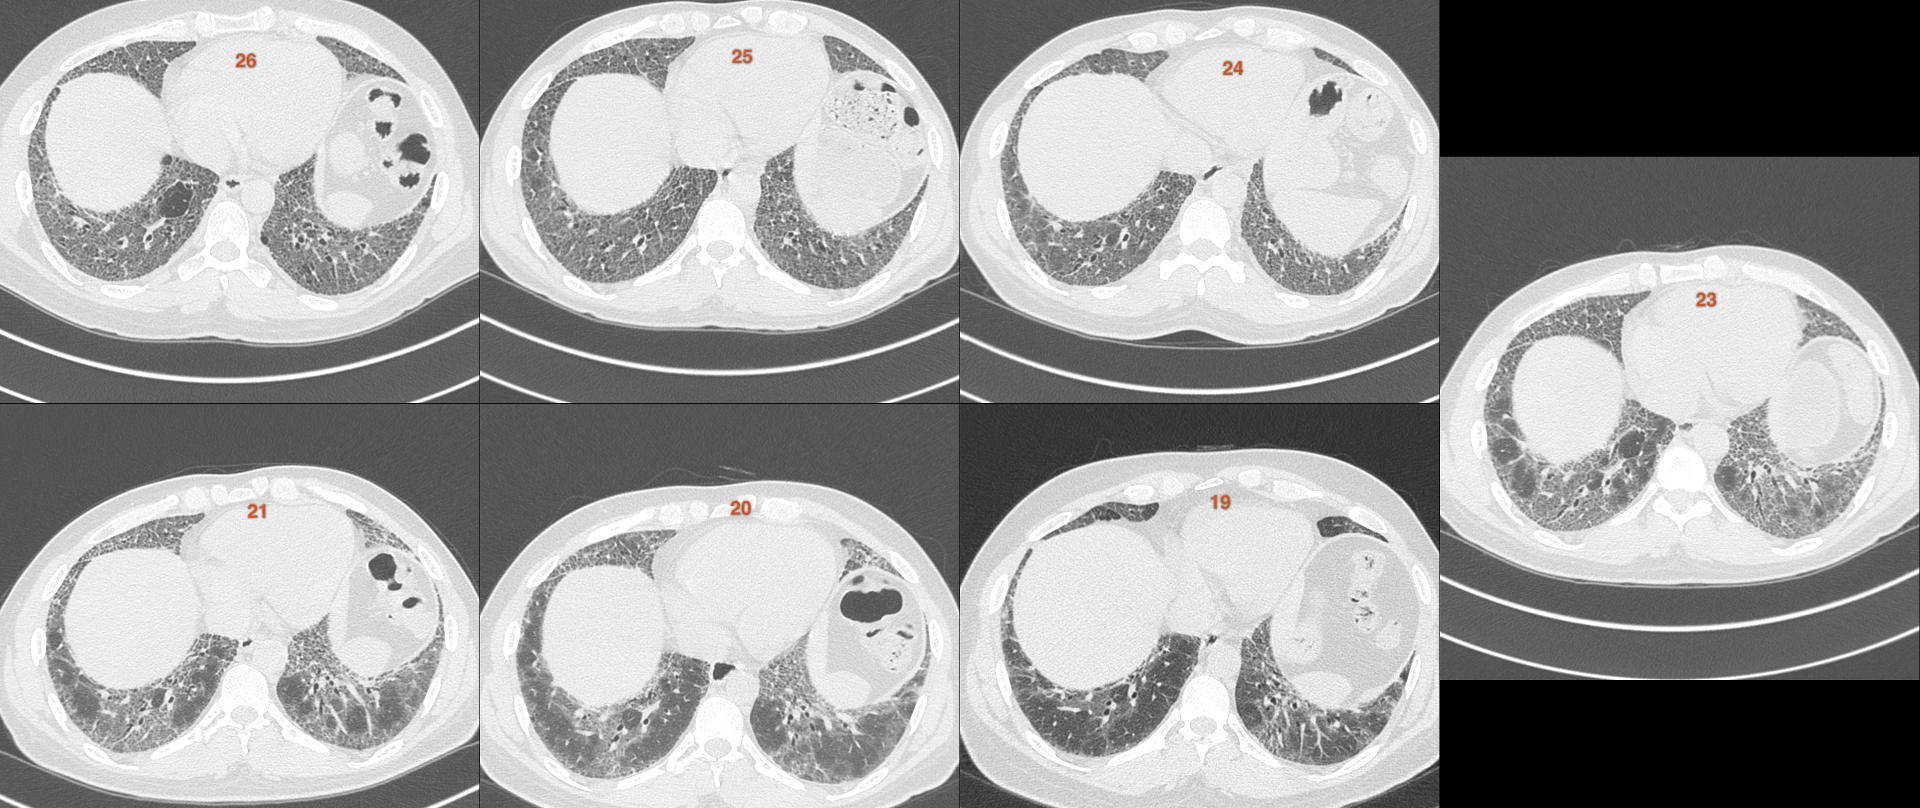
Here is a video that shows how I interpret the scans and all the 7 scans together.
The MDM diagnosis was fibrotic hypersensitivity pneumonitis though the appearance appears to be that of a connective tissue disease ILD.
However, this post is about quantification, which we do using Caliper by Imbio and how we can use AI to help with the process.
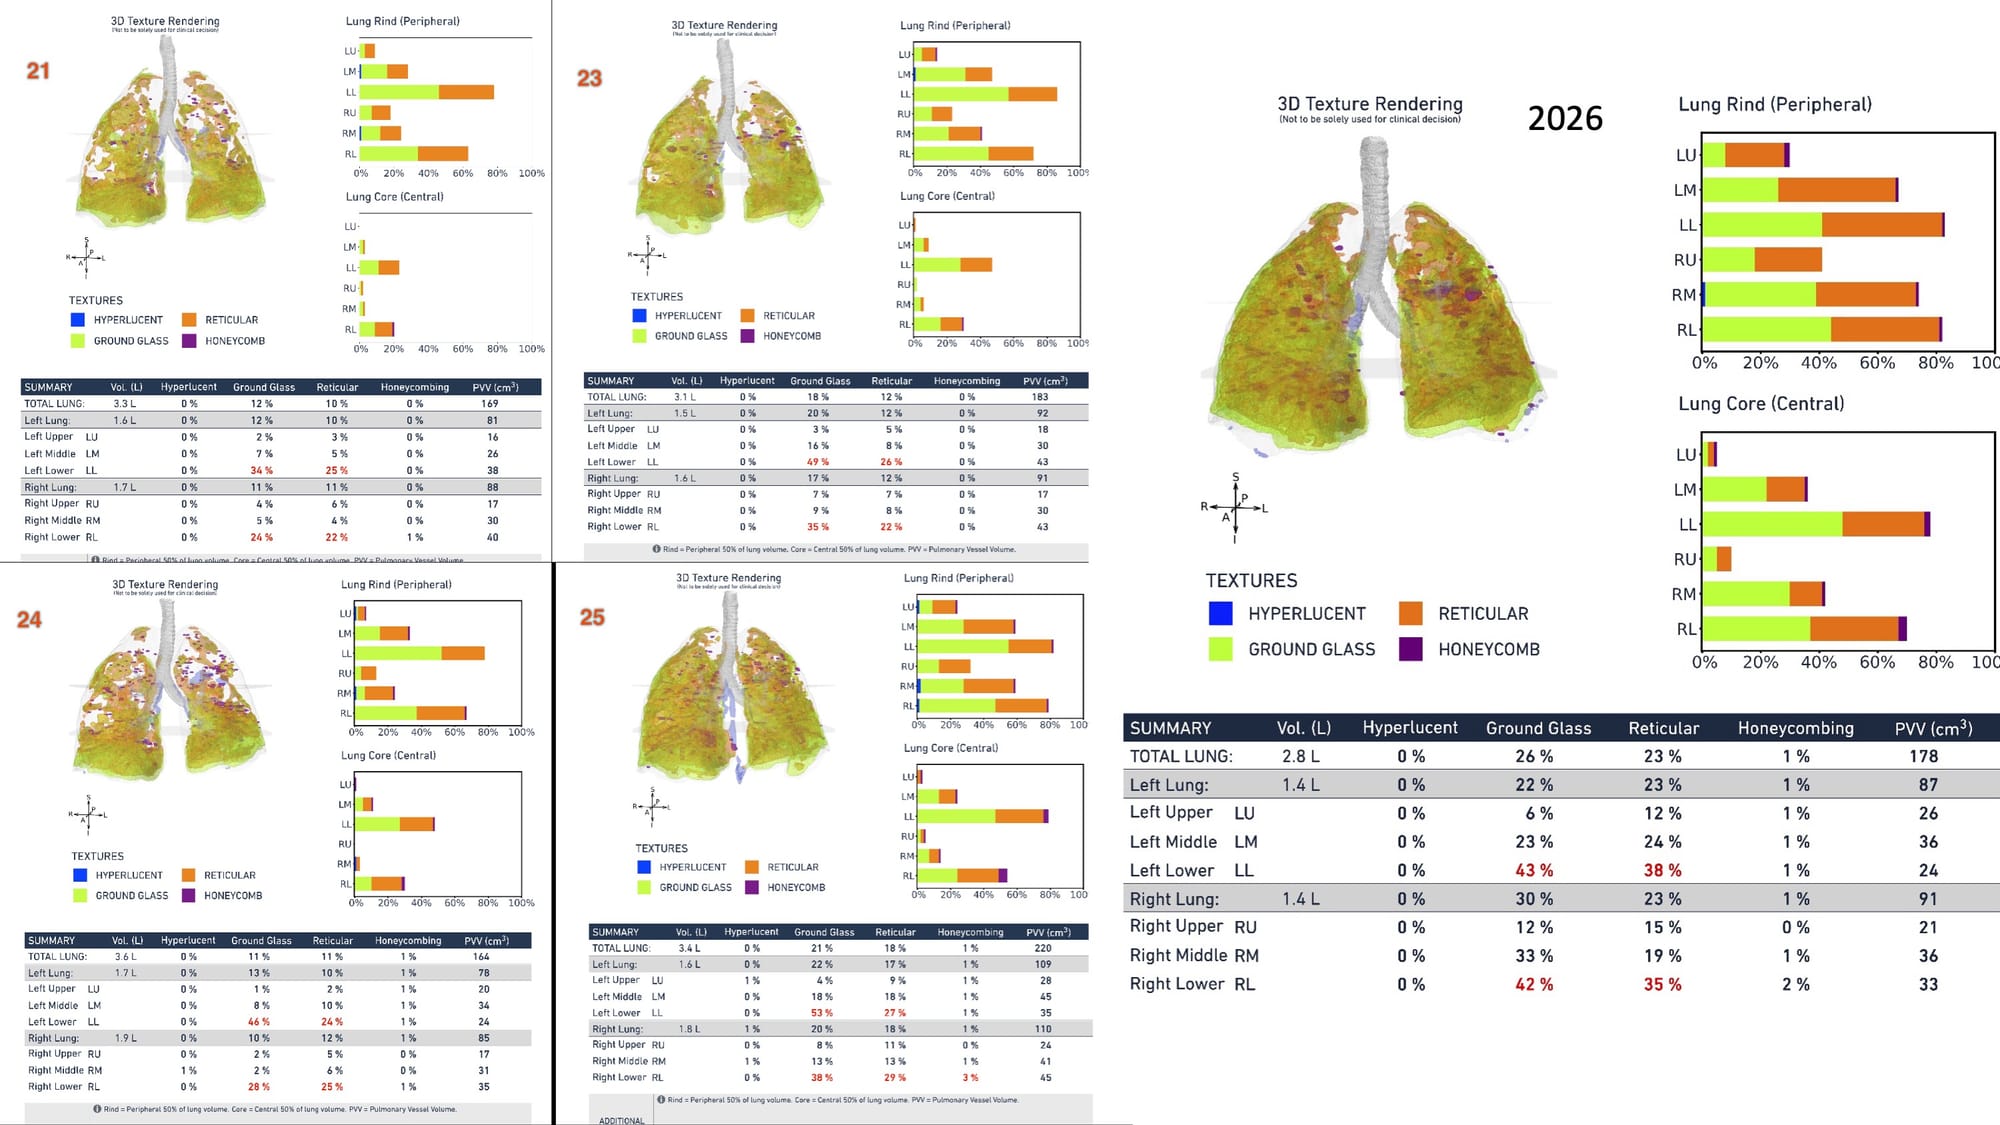
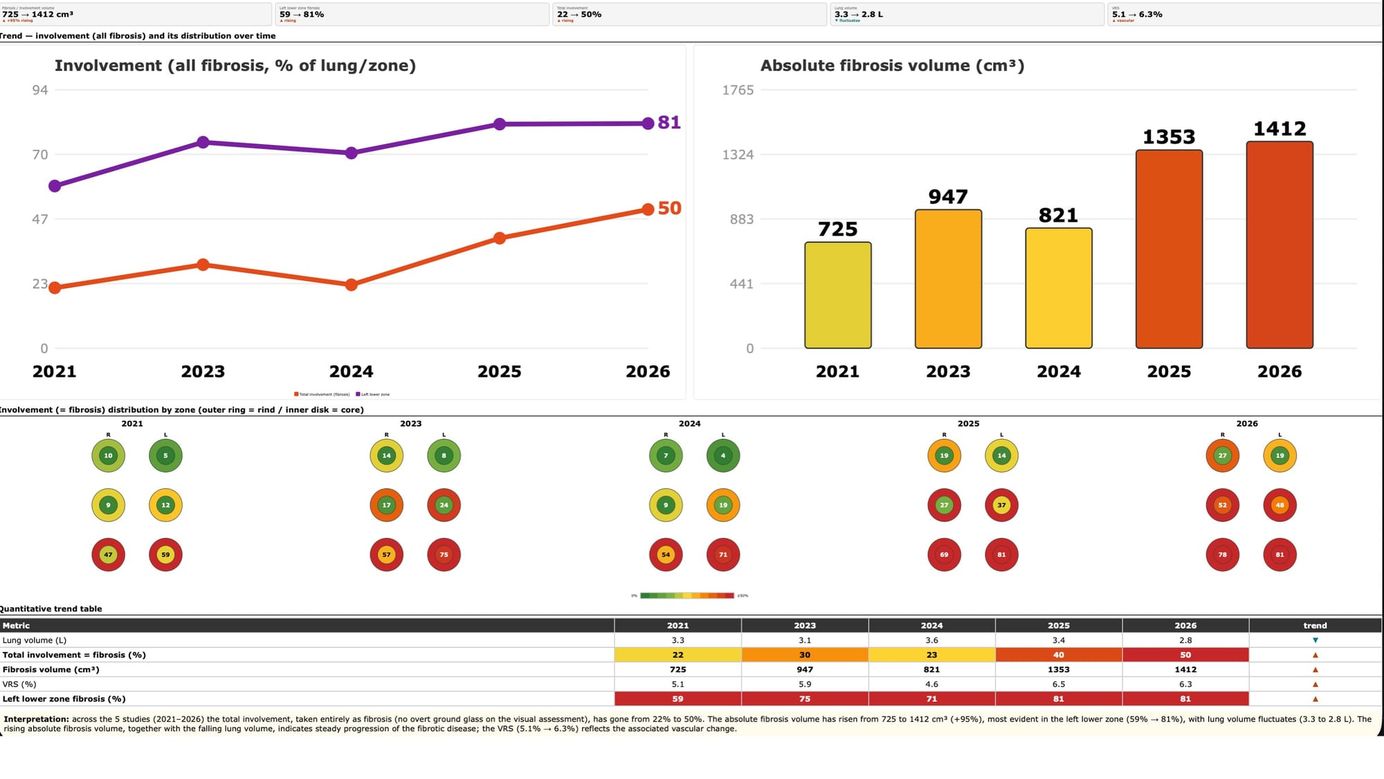
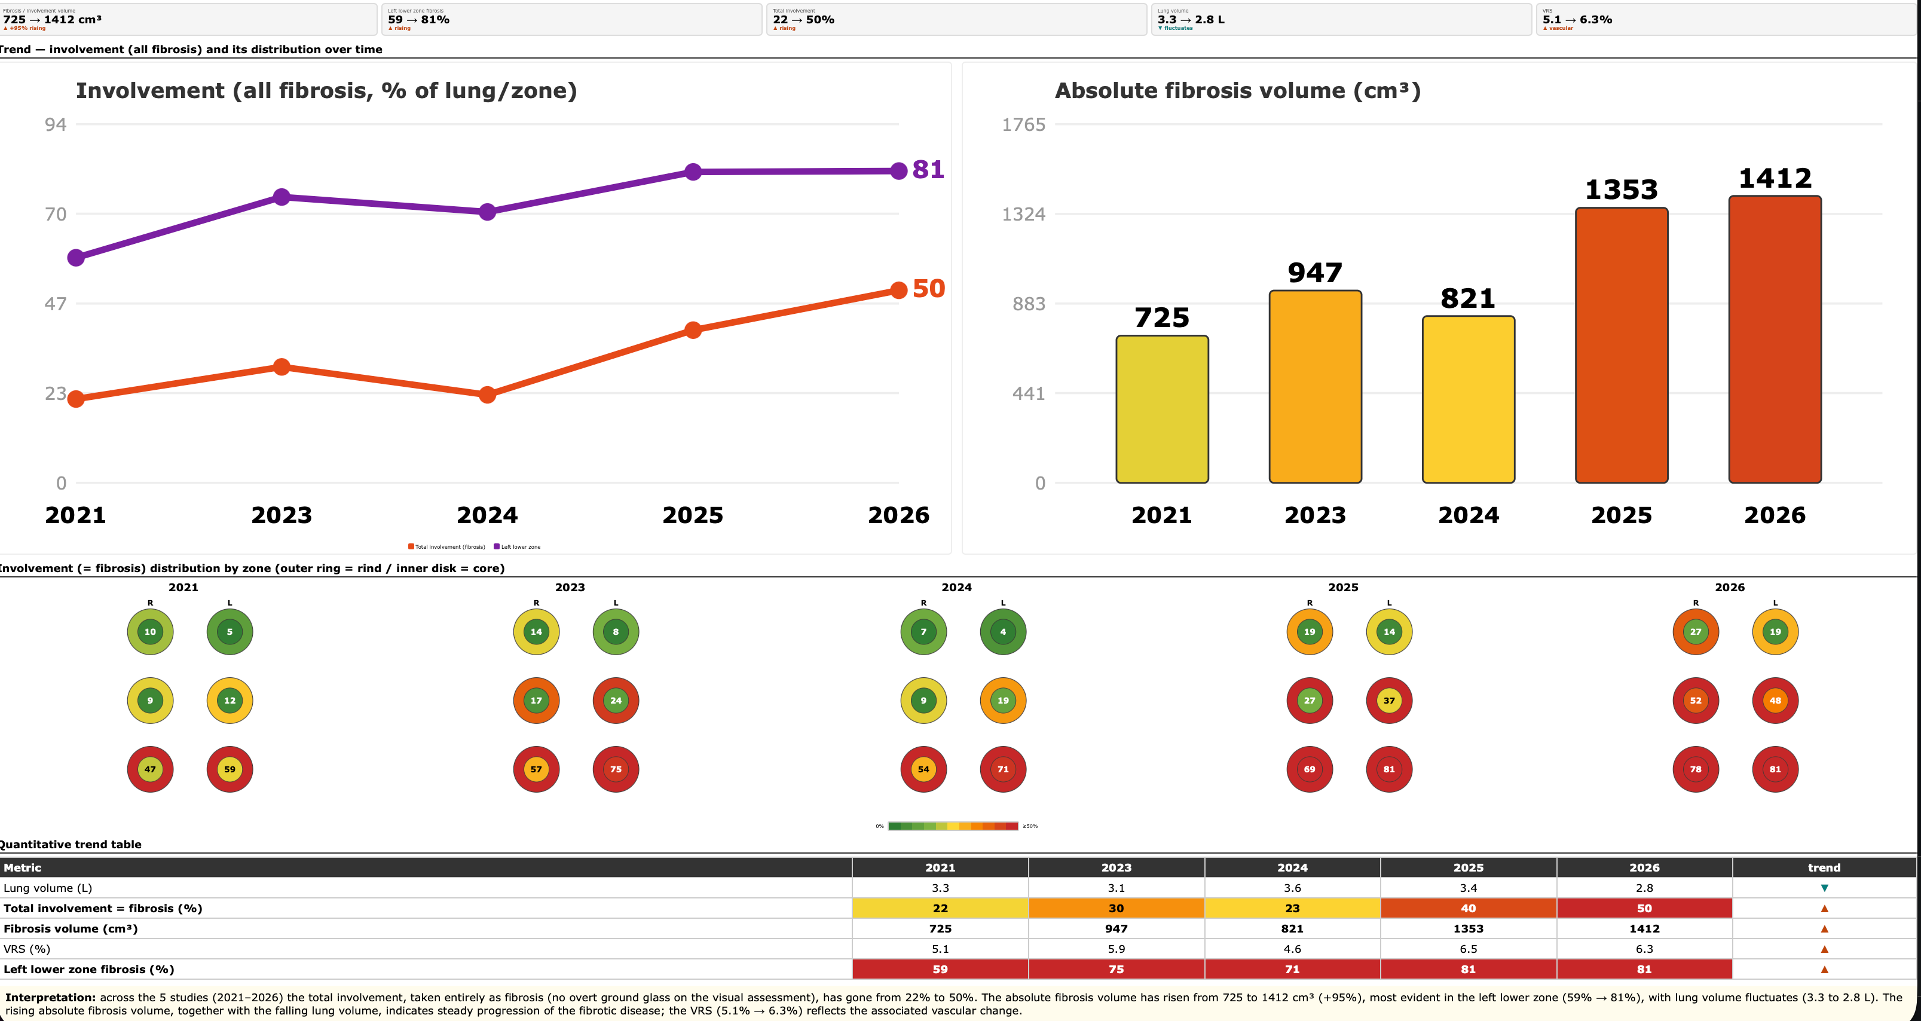
These charts are tough to analyze. If however you take the raw data from the .csv files and give appropriate instructions to the AI (Claude in this case), you can get the AI to interpret the changes and to pictorially depict these in an easy to understand manner as here
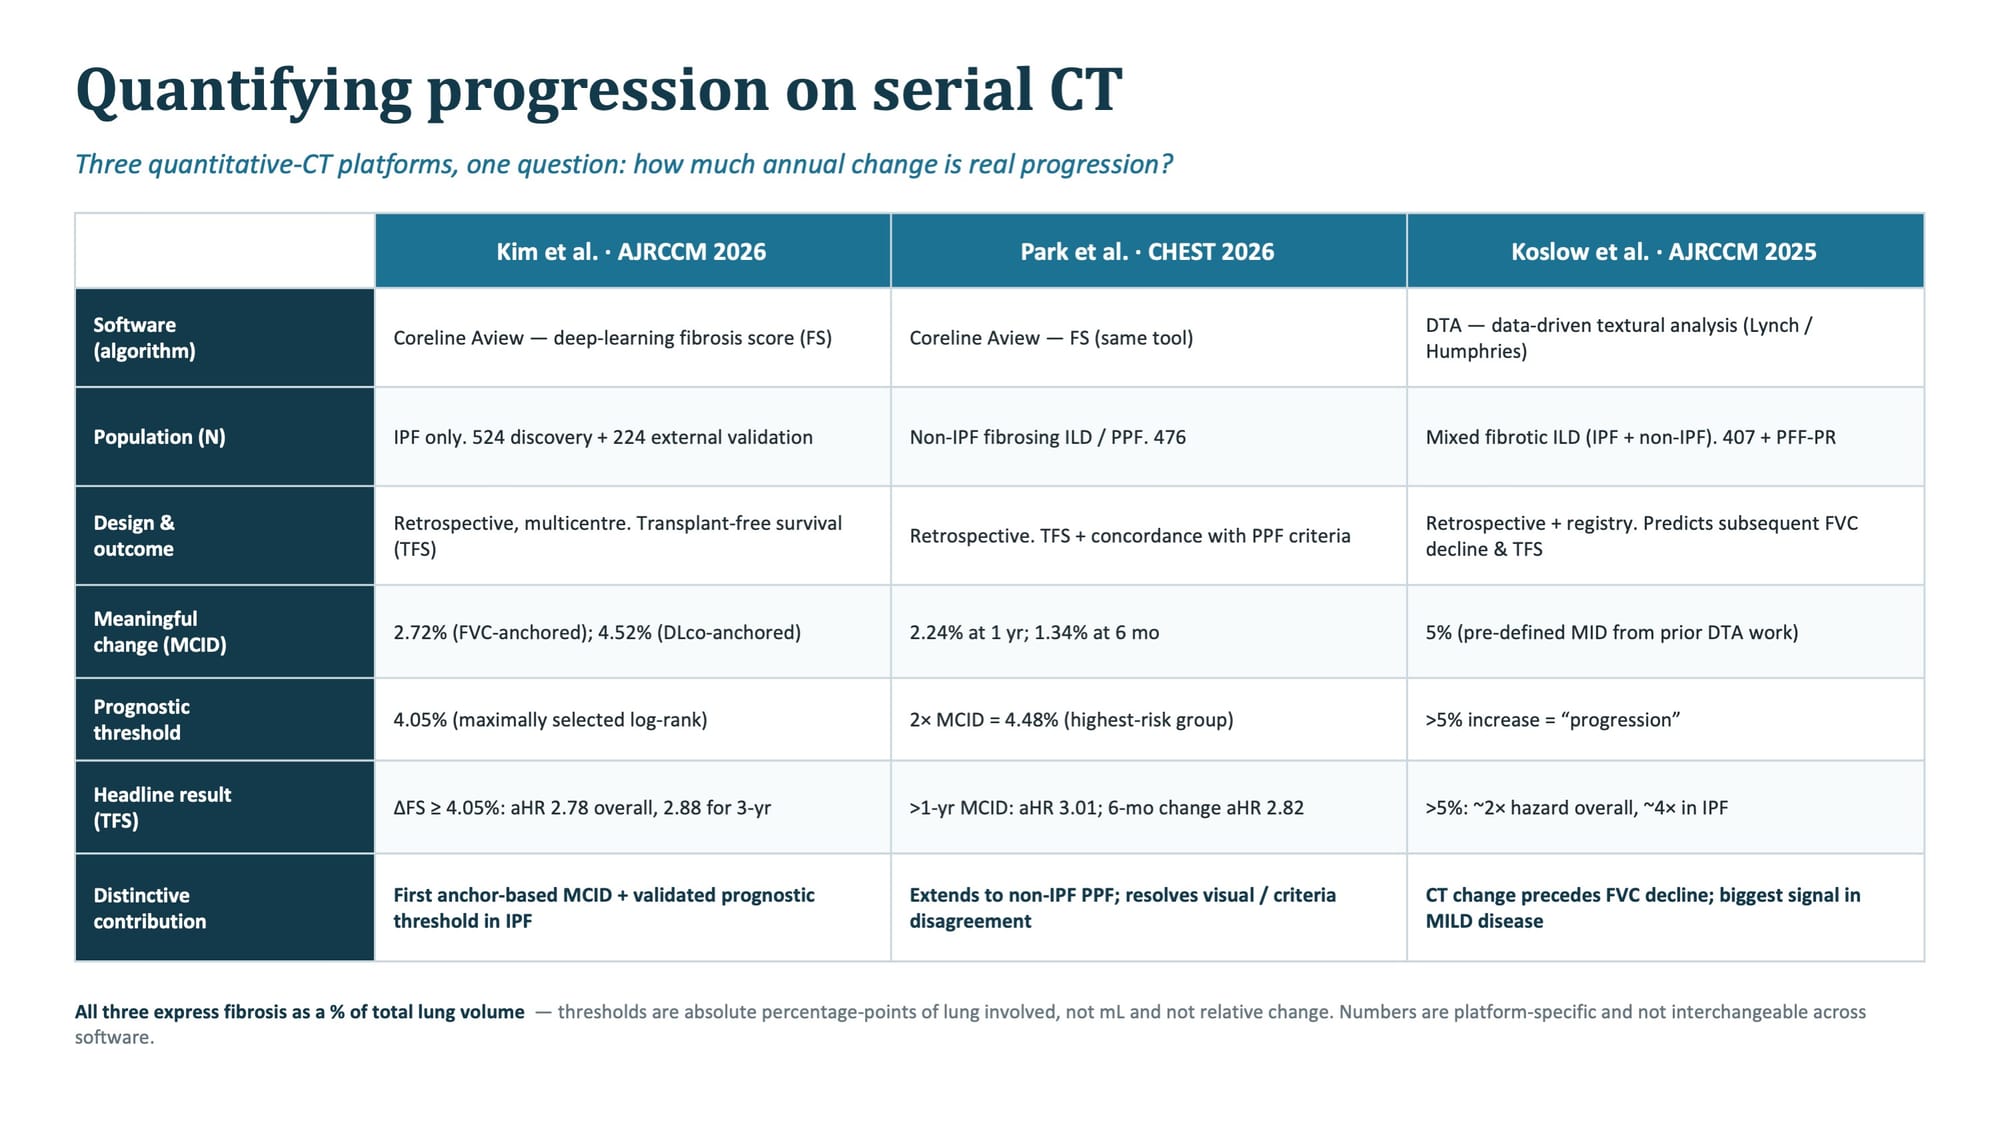
The post also looks at 3 recent papers that have tried to figure out the minimal clinically relevant change and the video below discusses these papers and the results.
This post is for subscribers only
SubscribeAlready have an account? Log in